1. Introduction
Digital Procurement has several benefits. Among others, providing end-to-end workflows to speed up processes, driving compliance by following set protocols, and offering insights into your spending and suppliers by collecting data and supporting the procurement spend analysis process.
In this blog, we will focus on what spend analysis is and how it can support your decision-making to improve procurement functions.
2. What is procurement spend analysis?
Spend Analysis or Spend Analytics is the process of collecting, cleansing, classifying, and analysing expenditure data with the purpose of decreasing procurement costs, improving efficiency, and monitoring controls and compliance. Source: Wikipedia
The main drivers behind spend analysis are profitability as well optimising cycle times within procurement processes.
The main aim is to spend better.
The visibility into spending and process cycle times can support procurement and financial management in reducing procurement and spending efforts.
The main elements of spend analysis include capturing, cleansing, organising, categorising and updating data as well as identifying the most important metrics necessary for how your business operates.
3. Why is spend analysis important in procurement?
A well-known saying is that if you don’t measure it; you can’t improve it. The same applies to procurement as much as any business process. The overall aim of spend analysis is to get closer to the who, what, when, where, why, and how of the organisations spending patterns and realising the benefits of spend analysis.
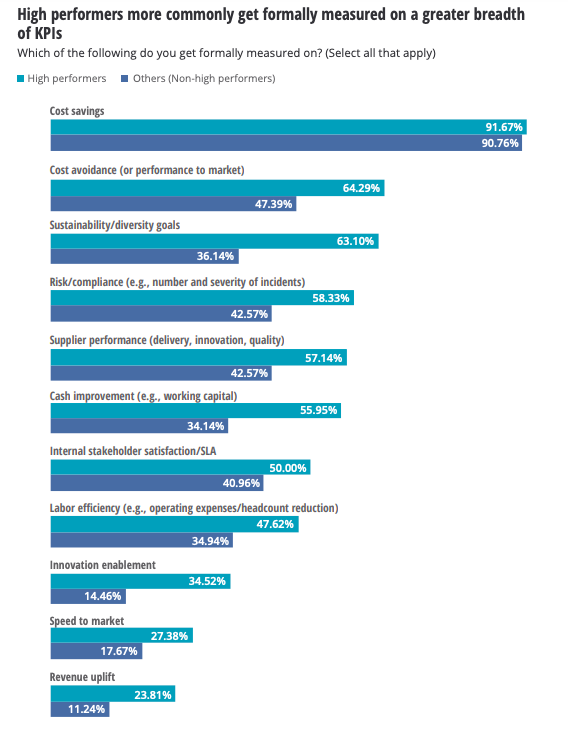
According to Deloitte’s 2021 CPO survey, cost savings and cost avoidance are still the primary benchmarks against which procurement is measured against, so the value of tracking the processes with data is clear.
Collecting and organising data across the procurement process opens opportunities in the following ways:
A. Greater visibility:
Data provides a window into the process and patterns of spend and supplier performance. Decisions on changing a supplier or negotiating better deals come as a result of understanding.
B. Managing risk:
Relying on too few suppliers can lead to dependency risk in operations. Maintaining data on your suppliers financial results or credit scores can help guide decision of whether supplier diversification is needed.
C. Better processes:
Intricately linked to the ROI of technology investments, is taking opportunities to improve processes early with new data and newer technology opportunities. Once a digital process is established, it can easily be honed to offer immediate benefits. Maintaining a long-term eye on process performance indicators, will bring further opportunities down the line.
D. Reduced cost:
Streamlining your procurement operation for example is a good project to involve stakeholders and identify areas for cost savings. By sharing the data among process participants, many ideas will surface on how to modify processes, redesign parts, combine orders, or automating tasks amongst others. This will contribute to a learner procurement process and is a key benefit of spend analysis.
E. Better relationships:
By involving your suppliers and service providers in discussions about your goals and by listening to their advice and feedback, spend analysis data can help support your discussions and help identify win-win benefits.
F. More organisation:
By managing all relevant data in one location, searching for information is instantaneous. This saves valuable time of employees as well as saving on maintenance and data loss costs.
4. Metrics to include into your procurement spend analysis dashboard
There is a long list of potential metrics possible which will contribute to spend analysis dashboards for leaders. Many metrics will be specific to the operations and processes of your business. We have identified some of the fundamental metrics providing a good base.
1. Purchase order cycle time/lifecycle: from purchase order creation to invoice payment. An overall metric of the procurement-supplier ability to deliver.
2. Requisition cycle time: from requisition submission to PO placement. This helps measure the time it takes the purchasing department to meet the needs of the organisation. This will include any approvals which can be measured separately to provide more information.
A. Can include # of interventions by key staff to see where agreed processes break down or budgeting/forecasting processes might be reviewed.
3. Supplier lead time: from purchase order confirmed to goods/service fully received (Delivery time – PO acceptance time). A subset of 1 more focused on supplier performance.
4. PO acceptance time: from purchase order creation to purchase order confirmation. Measures the responsiveness of the supplier and helps provide insight into any inventory availability issues. Also worth tracking will be the PO accuracy to be sure the right goods are ordered and delivered; this is the ratio of deliveries outside the expected target.
5. Compliance rate: disputed invoices / total invoices help
6. Total savings on procurement: savings per supplier category, total spends for the same good/service over a period compared to budgets or historic amounts. Provides an indication of the ability of the procurement function to negotiate and provides insight into budgeting accuracy. Can include:
A. Actual Purchasing Price – Lowest Price quoted (cost avoidance)
B. Actual Purchasing Price – Last Price Paid (cost saving)
C. Procurement Function ROI: (cost saving + cost avoidance) / cost of purchasing operations
7. Budget control and contract monitoring
A. Available budget per procurement categories.
B. Amount and percentage of a budget category covered/not covered by frame contracts.
C. Amount and percentage of call-offs of a frame contract
D. Total number, total amount and percentage of budget/frame contract covered by open purchase requisitions.
E. Total number, total amount and percentage of budget/frame covered by open purchase orders.
Other procurement KPIs:
1. Spend analysis: analyse spend plan vs actual, per category, per supplier, per department.
2. Emergency purchase ratio: measuring ‘# of emergency purchases / total purchases’ in a period by supplier to drive better estimations and frame contract decisions.
3. Vendor rejection rate: ‘# of rejected order items / total order items’ in a period by supplier helps monitor supplier quality performance.
4. GRNI report: Goods Received Not Invoiced report for Finance department monthly accruals.
5. Inventory Risk: where obsolescence is a problem, monitoring the total financial loss due to obsolescence / total worth of inventory helps track trends or point towards forecasting errors in operations.
6. Team Workload: # Cases / Procurement Team Member.
7. Frequency or Volume of Corrections or new tasks added in the process
5. Conclusion – How data-driven decision making can drive procurement ROI
As with any data initiative, the quality and accuracy of the data are paramount. It is also important that exception and manual workarounds are taken into consideration and used as inputs to modify processes even further.
The benefits of data are clear, and the value of having customised workflows that fit your business operations can’t be underestimated.
With Oriana’s Procurement Module, we can provide you with a core procurement solution to be tailored and extended as your organisation grows or you change your procurement operations. This flexibility is provided by the low-code approach of the platform upon which the procurement module is built. All relevant data can be extracted from the various systems used internally or at suppliers if needed. Together with the big picture benefit of having your procurement processes digitalised, therefore traceable, driving better decisions with data, will lead to better and leaner procurement operations.


